Data Science Portfolio
DRILL: Prepare the Data
For this drill we will use a 2013 dataset of crimes in New York state, by city.
import pandas as pd
from matplotlib import pyplot as plt
import numpy as np
from sklearn import linear_model
%matplotlib inline
ny_crime = pd.read_csv('table_8_offenses_known_to_law_enforcement_new_york_by_city_2013.csv')
ny_crime.head()
| City | Population | Violent crime | Murder and nonnegligent manslaughter | Rape (revised definition)1 | Rape (legacy definition)2 | Robbery | Aggravated assault | Property crime | Burglary | Larceny- theft | Motor vehicle theft | Arson3 | |
|---|---|---|---|---|---|---|---|---|---|---|---|---|---|
| 0 | Adams Village | 1,861 | 0 | 0 | NaN | 0 | 0 | 0 | 12 | 2 | 10 | 0 | 0.0 |
| 1 | Addison Town and Village | 2,577 | 3 | 0 | NaN | 0 | 0 | 3 | 24 | 3 | 20 | 1 | 0.0 |
| 2 | Akron Village | 2,846 | 3 | 0 | NaN | 0 | 0 | 3 | 16 | 1 | 15 | 0 | 0.0 |
| 3 | Albany | 97,956 | 791 | 8 | NaN | 30 | 227 | 526 | 4,090 | 705 | 3,243 | 142 | NaN |
| 4 | Albion Village | 6,388 | 23 | 0 | NaN | 3 | 4 | 16 | 223 | 53 | 165 | 5 | NaN |
# Select datafame columns
ny_crime = ny_crime[['City', 'Population', 'Murder and\rnonnegligent\rmanslaughter', 'Robbery', 'Property\rcrime']]

# Rename columns
ny_crime.columns = ['City', 'Population', 'Murder', 'Robbery', 'Property Crime']

# Remove commas from numeric strings
ny_crime['Population'] = ny_crime.Population.apply(lambda x: x.replace(',', ''))

# Change type to int
ny_crime['Population'] = ny_crime.Population.astype(int)

# Remove commas from numeric strings
ny_crime['Robbery'] = ny_crime.Robbery.apply(lambda x: x.replace(',', ''))

# Change type to int
ny_crime['Robbery'] = ny_crime.Robbery.astype(int)

# Remove commas from numeric strings
ny_crime['Property Crime'] = ny_crime['Property Crime'].apply(lambda x: x.replace(',', ''))

# Change type to int
ny_crime['Property Crime'] = ny_crime['Property Crime'].astype(int)

# Drop null values
ny_crime = ny_crime.dropna()

ny_crime.head()
| City | Population | Murder | Robbery | Property Crime | |
|---|---|---|---|---|---|
| 0 | Adams Village | 1861 | 0 | 0 | 12 |
| 1 | Addison Town and Village | 2577 | 0 | 0 | 24 |
| 2 | Akron Village | 2846 | 0 | 0 | 16 |
| 3 | Albany | 97956 | 8 | 227 | 4090 |
| 4 | Albion Village | 6388 | 0 | 4 | 223 |
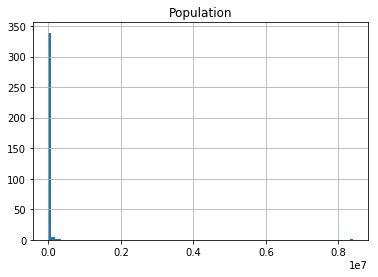
# Plot population distribution
ny_crime['Population'].hist(bins=100)
plt.title('Population')
plt.show()
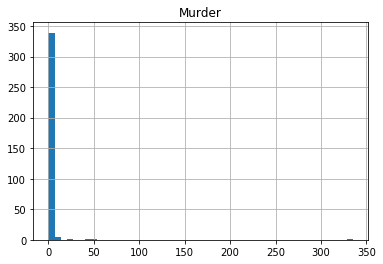
# Plot murder distribution
ny_crime['Murder'].hist(bins=50)
plt.title('Murder')
plt.show()
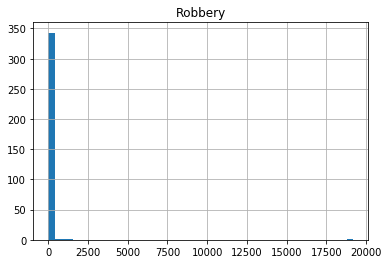
# Plot robbery distribution
ny_crime['Robbery'].hist(bins=50)
plt.title('Robbery')
plt.show()
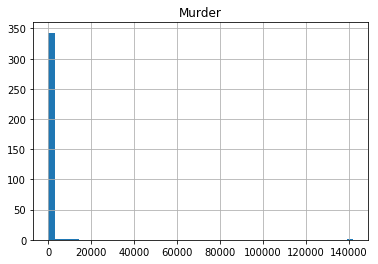
# Plot property crime distribution
ny_crime['Property Crime'].hist(bins=50)
plt.title('Murder')
plt.show()
# Filter out any outliers over two standard deviations above the mean
pop_cutoff = ny_crime['Population'].mean() + 2*ny_crime['Population'].std()
mur_cutoff = ny_crime['Murder'].mean() + 2*ny_crime['Murder'].std()
rob_cutoff = ny_crime['Robbery'].mean() + 2*ny_crime['Robbery'].std()
prop_cutoff = ny_crime['Property Crime'].mean() + 2*ny_crime['Property Crime'].std()

ny_crime['Population'] = ny_crime.Population.map(lambda x: x if x < pop_cutoff else None)
ny_crime['Murder'] = ny_crime.Murder.map(lambda x: x if x < mur_cutoff else None)
ny_crime['Robbery'] = ny_crime.Robbery.map(lambda x: x if x < rob_cutoff else None)
ny_crime['Property Crime'] = ny_crime['Property Crime'].map(lambda x: x if x < prop_cutoff else None)

ny_crime.describe()
| Population | Murder | Robbery | Property Crime | |
|---|---|---|---|---|
| count | 347.000000 | 345.000000 | 347.000000 | 347.000000 |
| mean | 15956.685879 | 0.350725 | 17.867435 | 385.752161 |
| std | 27080.218837 | 1.587160 | 94.972492 | 1034.369072 |
| min | 526.000000 | 0.000000 | 0.000000 | 0.000000 |
| 25% | 2997.000000 | 0.000000 | 0.000000 | 40.000000 |
| 50% | 7187.000000 | 0.000000 | 1.000000 | 112.000000 |
| 75% | 18160.500000 | 0.000000 | 5.000000 | 340.500000 |
| max | 258789.000000 | 21.000000 | 1322.000000 | 12491.000000 |
# Create new feature
ny_crime['Population^2'] = ny_crime['Population']**2

# Convert specified columns to boolean
for col in ['Murder', 'Robbery']:
    ny_crime[col] = ny_crime[col] > 0

ny_crime.head()
| City | Population | Murder | Robbery | Property Crime | Population^2 | |
|---|---|---|---|---|---|---|
| 0 | Adams Village | 1861.0 | False | False | 12.0 | 3.463321e+06 |
| 1 | Addison Town and Village | 2577.0 | False | False | 24.0 | 6.640929e+06 |
| 2 | Akron Village | 2846.0 | False | False | 16.0 | 8.099716e+06 |
| 3 | Albany | 97956.0 | True | True | 4090.0 | 9.595378e+09 |
| 4 | Albion Village | 6388.0 | False | True | 223.0 | 4.080654e+07 |